Author: Cyril Ogana
Viewers: 1,335
Last month viewers: 1
Categories: PHP Tutorials, Sponsored
PhpED is one of the oldest PHP IDEs that integrates this possibility to debug PHP scripts running them step by step either from a command line, or even in a Web server which is the most common and hard to debug environment.
Read this article to learn how PHP code debugging works and how you can do it from the comfort of a PHP IDE like PhpED.
Contents
Introduction
Installation of PhpED
Debugging Existing Applications
Techniques for Debugging Your PHP Application
Setting Up Debugging on PhpED
Try PhpED Debugging Support For Free
Conclusion
Introduction
As we all know, debugging is the process of finding and solving bugs or defects that prevent the correct operation of computer software or a system, according to the Wikipedia definition.
Debugging is inevitable in any development environment and has the potential of adding a considerable amount of time to your project, perhaps even increasing exponentially depending on the complexity of your code eventually getting it out of control.
While you may not be able to accurately estimate how much time you will spend debugging, you can mitigate the bug problem itself by developing your application using good design architecture and patterns, good automated testing methods, and debugging the application using a systematic approach.
The old adage prevention is better than cure comes to mind. I will not discuss architecture and design here. There are plenty of resources online about that, particularly popular from Martin Fowler's blog on design patterns as well as from the "Gang of Four" Patterns.
This article is about debugging PHP applications using PhpED which the IDE that I use. I first used PhpED for this when I had to debug a legacy application built with the Openbiz-Cubi framework that did not correctly implement the expected control flow when a third party authentication plugin was used instead of the default plugin.
While you can debug your application without dedicated debugging tools, you will save yourself a considerable amount of project hours by using a powerful debugger that is integrated with your IDE. In the case of this article I will cover my "weapon of choice": PhpED.
Installation of PhpED

PhpED is an IDE developed by NuSphere. It is probably the oldest PHP IDE in active development that can be used for debugging PHP applications since 2001. The IDE comes with a powerful debugger which is built a top the DBG Debugger extension. You can download a copy of PhpED from NuSphere site. PhpED is currently in version 16 and you can try it for free during a 14 day trial period.
It has a good community with an active support forum which you can access to post your questions or find tutorials in the numerous topics they have about various development issues with some topics including debugging.
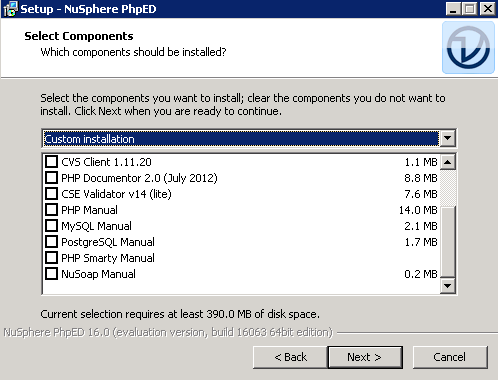
When installing the IDE you have the option of installing additional resources such as manuals, browser toolbars and inbuilt browser environments.
Debugging Existing Applications
A number of the older products my company sells run on the Openbiz-Cubi framework, which is a good but legacy PHP framework which is no longer in maintenance as its core team decided to do a NodeJS rewrite. A review of security policy at one of our clients warranted the installation of our two factor authentication package (2FA), which is hosted on Github.
Openbiz-Cubi is straight foward and component based. From the documentation, we were able to write a service file (plugins are called services in Openbiz-Cubi) for the authentication, as well as modify the form objects to handle a 2 step login workflow.
An article describing how we did it can be found in the package blog.
The refactoring was done in several iterations, first making minimal code changes to the legacy application. Once the plugin was activated, we were able to log in, send an SMS token to a user and finally authenticate that stage to proceed to the users landing page.
While having made this change with minimal customization of the legacy application code, we had to locate the point in the legacy application where the User profile is written to the session.
The low level documentation on the underlying framework was lacking, thus we had to take an exploratory approach. It would be suicidal if we were to write the user profile to session before authenticating the second stage of the login. We are not security experts though and we were well guided. If you are interested in getting to learn more about two factor authentication there is a good article here.
Techniques for Debugging Your PHP Application
The diagram below shows the techniques available to you when using PhpED while debugging your application. Whichever debugging strategy you use, you can use one or a combination of these techniques to achieve your goal. In this article, we used techniques in the area highlighted in green.

Setting Up Debugging on PhpED
Setting Up The Project
We set up the project to contain the Cubi application that was locally installed on the server. You can configure local and remote projects with PhpED. To create the project, click on File >> New Project.
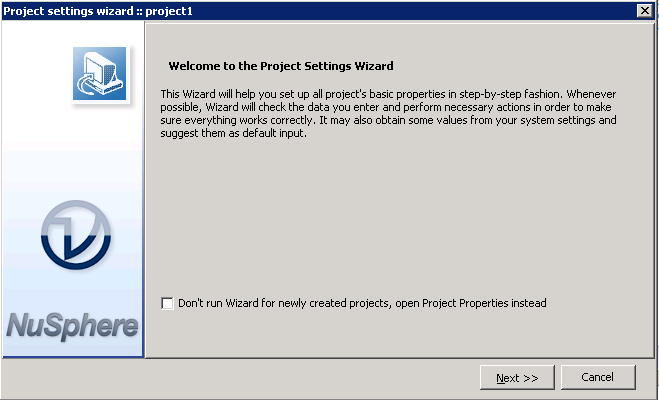
Our project files were on the local server, running Apache 2.4.
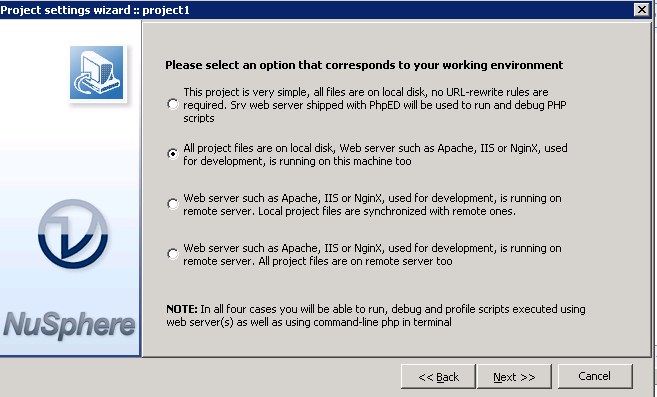
Since this is a Web based application, we selected execution by Web server.
Our Document Root for this project was the Cubi folder.
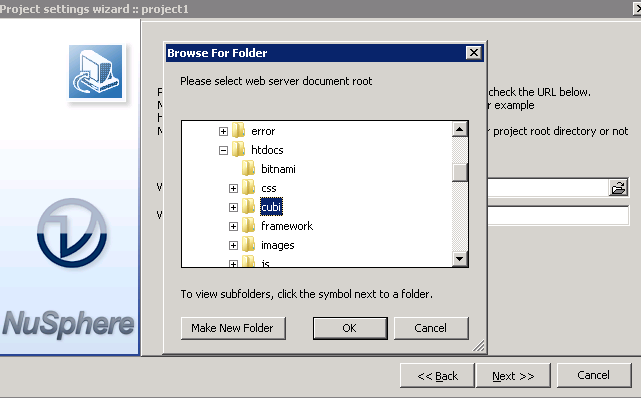
It is a good idea to check the installation in order to ensure everything is in correctly set for your project setup, especially the debugging environment.
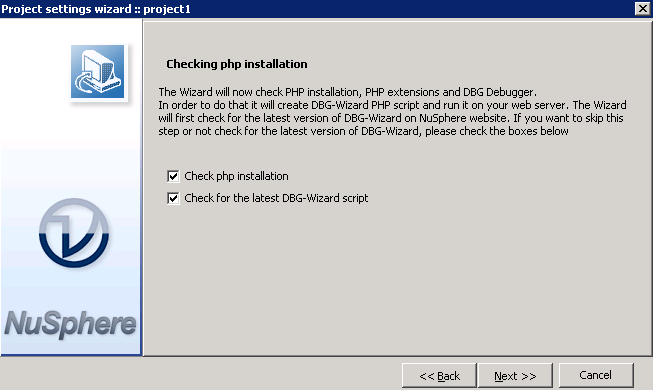
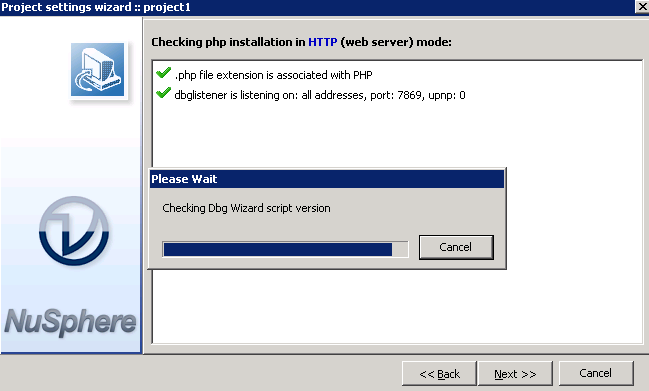
The installation check should take less than 60 seconds.
We received a clean bill of health from the installation check up, so it is time to do some work then .
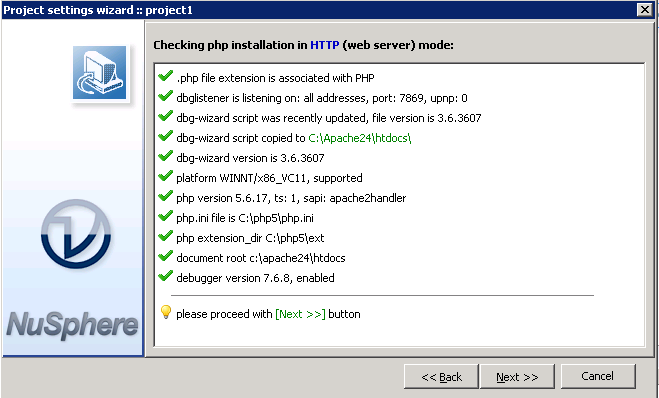
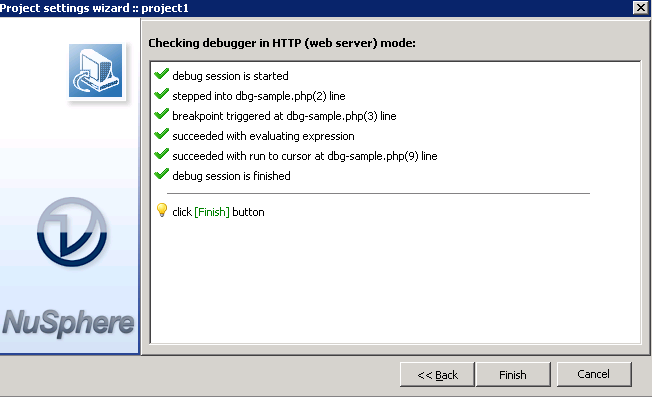
Our debugger check went okay as well.
Configure the Debug Settings
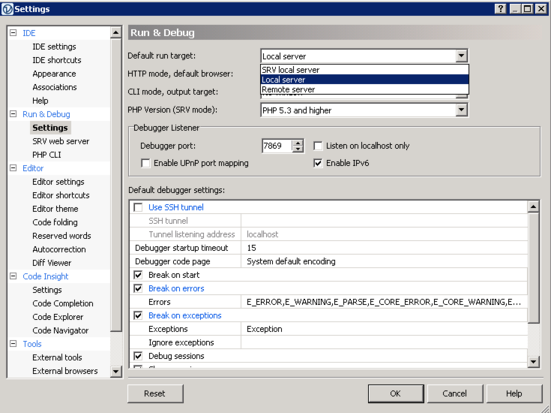
After setting up our project, we set the debugger to use the Local Web
server (Apache in our Case, by clicking on Settings >> Run &
Debug >> Settings then selecting "Local server" option. The remote
server option is used when you are debugging code on a remote server.
SRV local server refers to PhpED's built-in Web server, which is useful
for simple scenarios.
Debugging the Application Login Work-flow
Having our project and debugging setup, we proceeded to debug the login workflow of the application prior to making changes. The exploratory approach would enable us take notes along the way regarding various aspects of the framework e.g. MVC implementation, session handling.
From the documentation, we knew that all Openbiz-Cubi calls are routed through the index.php file. We thus opened up this file in the PhpED IDE and run it in the debugger. The illustration below shows where to access the debugging tool on our IDE.

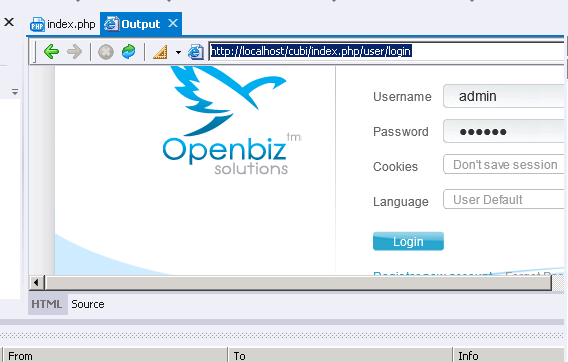
The debug output settings for our project were set to point to the IDE's internal browser. This opened up the internal browser as a tab as soon as we started the debug process, and were any change made to the UI, or a page redirected, it would be updated. As expected, a visit to the index.php loaded the login page by default, as there was no session initialized yet.
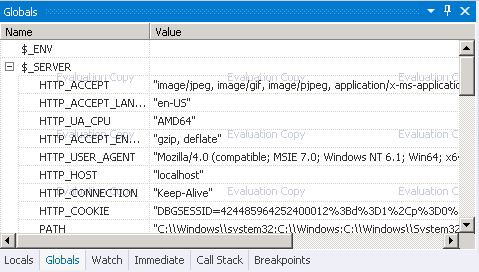
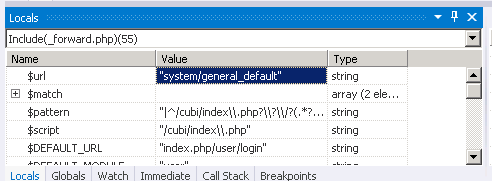
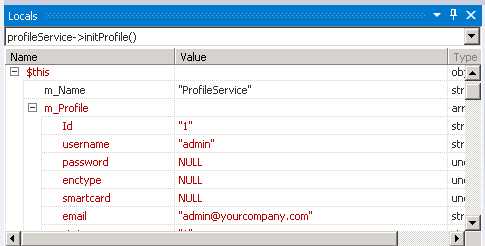
Previously I mentioned the Local, Global and Watch variables windows. These show the variables that are accessible in the current stage of the program execution, as well as indicating the values of these variables. You can activate these windows by clicking on Debug >> View >> Debug Windows then selecting the window to activate.
These windows enable you to establish whether a statement of code or a function call sets variables to an expected state; as well as enabling you view the global state of your application at runtime.
On accessing index.php, we can see the value of various Globals, including our DBGSESSID variable, which is set by the PhpED debugger to manage the debug session.
Also mentioned was that our intent was to step through the code until we established the point at which the user profile is written to the session. This would thus be refactored to make it 2FA safe.
There are four ways to step through code:
Step in: This is very useful when debugging the code step by step. With this technique, when a function is about to be called and you step in, you are directed to that function to continue debugging step-by-step.
Step out: This executes the remaining lines of a function in which the current execution point lies. The next statement displayed is the statement following the function call.
Step over: This executes one line and places the cursor in the next line after the executed one. Thus, to compare it against step in if the line you stepped over was a function call, there will be no iteration over the statements in the function. While if you stepped in, there would be a redirection to the called function.
Jump to Cursor: With this technique, all statements between the current line of execution and the cursor will be executed
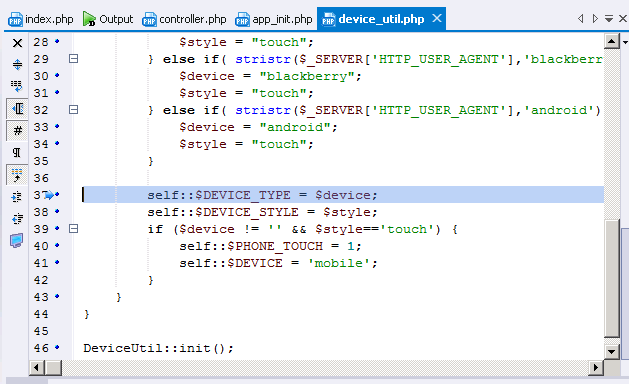
During the debug run, we at times stepped in to calls that were not relevant to our cause, but quite interesting. Here we see that the application attempts to establish which client you are using to enable it load the appropriate view. Such code could be stepped over / out of to speed up your debugging work.
A bluish arrow on the line number will let you know at which line of execution the debugger is. (Line 37 in the below image). If that is a breakpoint, there will be an additional red circle on the line.
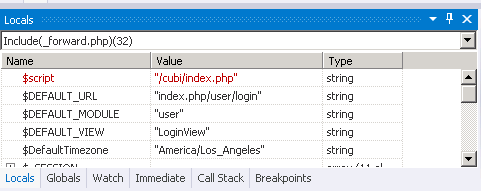
The Local Variables window was always in our sight. Even before reaching the authentication code, we were taking a lot of notes. Here, we see the routing code bootstrapping before redirecting to the login code. This was documented as it could be important information for future re-factoring.
When the debugger stepped into the LoginForm.php class, we knew we had gotten to the authentication code range. We reverted to using only Step In function so as to track each statement and effect on the variables. If you use the step over or step out carelessly, you may end up iterating over the program execution stage you are targeting or looking for and having to restart the process again.
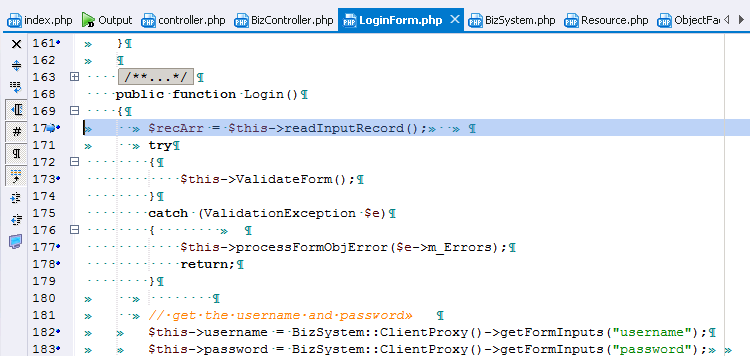
Our exploration led to the LoginForm.php file which is in the user module of the Openbiz-Cubi framework. We identified a call to the profile plugin (service) which initiates a user profile and was followed by a call to the session service to load that profile to the session. All this, in a matter of 30 minutes or so.

The Locals variable window indicated that the user profile was now in session, complete with the user name and other details. At this point, we knew where to concentrate our refactoring efforts to enable the 2FA plugin to work safely.
Try PhpED Debugging Support For Free
All this that I demonstrated you can try for free downloading PhpED from their site. The trial version works well enough for you to evaluate it without compromise for 14 days. If you like it, you can upgrade later to the full version anytime.
Conclusion
In this part of the article we have illustrated how we used PhpED Debugger to find bugs and help refactor a PHP application. The debugger allowed us to quickly understand the user authentication workflow of Openbiz-Cubi and determine the exact changes that needed to be made.
This allowed us to write safe 2FA openbiz-cubi code, with the first stage initializing session without the user profile, while the second stage initializing with user profile if the token is correct.
The advantage we got from this approach was that we did all of this on top of Openbiz-Cubi's native session handler without having to rewrite it. The debugger allowed us to see the exact parameters to refactor to achieve this.
Remember to make good use of the Variable windows so as not to miss out of an important stage change in one of your variables.
In the next parts I will talk about debugging a project using a framework like Symfony and how to debug live projects running on remote Web servers.
If you like this article or you have a question about debugging PHP projects, post a comment here.
You need to be a registered user or login to post a comment
1,616,870 PHP developers registered to the PHP Classes site.
Be One of Us!
Login Immediately with your account on:
Comments:
2. PHPEd is died - Roman Che (2016-04-30 19:04)
Where is PHPEd?... - 6 replies
Read the whole comment and replies
1. i prefer open source IDEs - Jos� Filipe Lopes Santos (2016-03-31 21:57)
i prefer open source IDEs... - 3 replies
Read the whole comment and replies


