Author: Joseluis Laso
Viewers: 2,183
Last month viewers: 1
Package: PHP Stats Graphs
Read this tutorial article to learn how you can use the PHP Stats Graphs package to extract statistics of application events and show them in nice vectorial graphics.
Contents
Installation
Configuration (optional)
How it works?
Running the examples
Online Demonstration
Conclusion
Installation
First we need to install the PHP Stats package. The most recommended way is to use the composer tool and add this package in the list of packages to install for your projects.
You can go to the package from here and check the download section tab for installation with the composer tool directly from the PHP Classes site own Composer repository. You can also follow the instructions you can find in the README.md file.
Configuration (optional)
You can have a configuration file in order to setup the library so it knows where it can store a database file to store the data to appear in the charts, as well other configuration values. You can copy the distribution file config-stats-base.yml.dist to the root of your project with the name config-stats-base.yml
This file has the following values:
database:
    driver: pdo_sqlite
    path: "%project_dir%/app/cache/simple_stats.sqlite"
    charset: UTF8
models:
    - clicks
    - ips
    - logins
The database key configures how the SQLite will be used. The models key defines the details about the events we want to register.
Any change on any of these keys requires remove the SQLite database file in order for the package to recreates a new database file. For now no migration process is supported.
How it works?
This package generates charts in SVG format to show the output statistics.
The package provides a couple of scripts that you can start from terminal console.
This package can generate random data for demonstration purposes using a command class. In real applications you would have a command class to retrieve the real logged event data to be displayed in the charts.
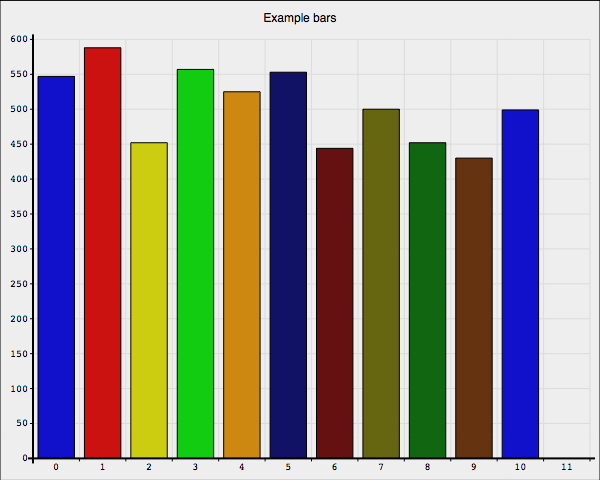
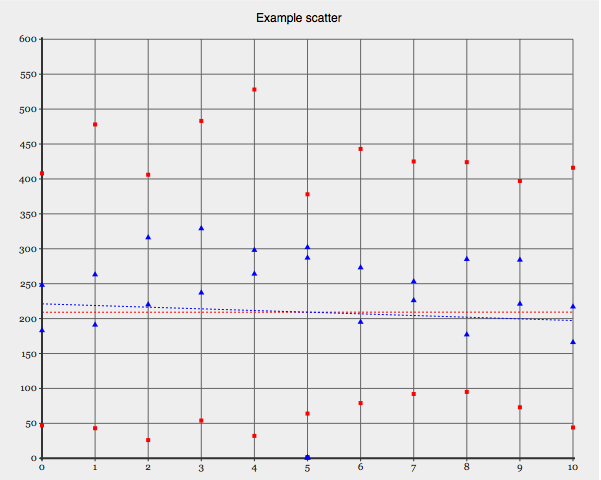
This package uses a third party SVG library in order to render statistical data as graphical charts. For now are there are two types of available graphs:
Bar charts
Data values displayed as bars

Scatter
Data values with X reference (2D) with one or several dimensions

Running the examples
To show the examples you start PHP built-in server from the terminal console in the root folder of the project.
php -S localhost:8000
Now you can use your favorite browser and access http://localhost:8000/samples/index.html. For now there are only two examples. You will see the same data in the two types of charts.
Online Demonstration
Just to show how easy is to include this package in your own applications I have created a simple demo that you can find in separate github repository.
You can see this package demonstration in action here.
Conclusion
As you may have understood, this package makes it easy to render nice graphs about data from logged events or other type of data source that you can build using your own custom command classes.
If you liked this article, please share it with other developers. If you have questions, post your comments here.
You need to be a registered user or login to post a comment
1,616,872 PHP developers registered to the PHP Classes site.
Be One of Us!
Login Immediately with your account on:
Comments:
1. How to integrate with logging ? - Lorenz Meyer (2016-08-04 09:05)
There is no documentation about logging the data.... - 0 replies
Read the whole comment and replies


