Author: Joseluis Laso
Viewers: 840
Last month viewers: 82
Package: PHP Preemptive Cache
Read this article to learn techniques to detect what PHP code is causing your application to run so slow.
Contents
Introduction
Detect Blocks and Recurrence
Determine If the Script Can Be Improved
Using XDebug and Analysis Techniques
Measurement
Using Caching to Reduce Execution Time
Conclusion
Introduction
Sometimes you have to deal with a script that runs terribly slow and gives you a headache because it makes your server run too slow.
I am talking about the typical script that summarizes or archives long quantities of data, or generates large XML documents or a very complex report for the company finance people.
It is probably a script that was written a long time ago by you or a colleague, that was improved regularly, but maybe carelessly.
Then, there is a moment you see that its execution takes more than the expected, probably due to the code that was added thoughout the time or the database that has grown a lot.
It's time to take a look at this code again and try to decrease its execution time. The first thing to do should be to refactor all the code, as much as possible. When all the refactoring process is done and all the time that can be gained was gained, it's time to use other measures.
Detect Blocks and Recurrence
Although we can detect recurrence and blocks manually, it is better to use tools for this task. Anyway, we can take a look over the script trying to detect all the blocks and check if the technique presented here will be helpful or not.
Next, in the article, we will learn how to measure the performance of our scripts and obtain mathematical proof that justify doing the refactor.
Determine If the Script Can Be Improved
Unfortunately it is not always possible to improve the performance of a bad script. Maybe it lasted there while the database did not have too many records. This technique is not a magic rule that you can apply to any script and always obtain a real benefit.
At the end of this article you will be able to detect these bad approaches and eventually prevent using them again when you write your code.
In other occasions you will determine that the improvement cannot be obtained because using this technique increases the time instead of decrease it.
Using XDebug and Analysis Techniques
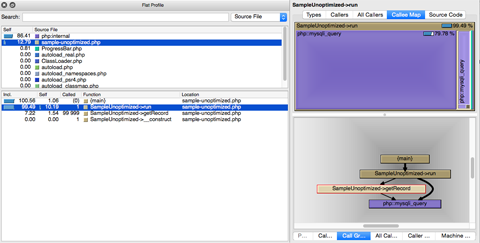
If your concern is to do a very professional job, it is useful to have installed some tool like Valgrind (QCacheGrind for Windows or Mac OS, KCacheGrind for Linux) to analyze the xdebug results. Often will give you a point to start looking how to improve your code.

Measurement
The way that we will measure how long our scripts take to run will be using the "time" command in Linux or Unix like environments.
Say that our script is task1.psp:
<< time php tas1.php ..params.. >>
Using Caching to Reduce Execution Time
One common way to improve the performance of slow code is to use cached data to reduce the time to access the same data again.
In order to know if a simple cache will decrease the time of execution of our script, we need to know if there are repetitions on the code, i.e., if it accesses to same database record several times.
First of all locate the piece of code that fetch the record from the DB. I have called it fetch_record( $id ) in order to simplify the example.
//..
 fetch_record($id)count
//..
So, at the beginning of the script, class or whatever, we have to create an array $analysis = array();
And we will put this assignment statement exactly after the code that fetched the record from the DB:
//..
 $analysis[$id] = isset( $analysis[$id] ) ? $analysis[$id] + 1 : 1;
 fetch_record($id);
//..
Now, just before the end of our script we�ll put this piece of code:
function analyse($info)
{
 $total = $saved = $repeated = 0;
 foreach ($info as $id => $count) {
 if ($count>1) {
  $saved += $count - 1; $repeated++;
 }
 $total += $count;
 }
 print_r(array(
 'total' => $total,
 'repeated' => $repeated,
 'saved' => $saved,
 'count' => count($info),
 ));
}

analyse($analysis);
And, launching the script again we will see the result of the analysis array:
Array
(
 [total] => 100000
 [repeated] => 1000
 [saved] => 99000
 [count] => 1000
)
The meaning of each key is:
- total: represents the total of reads produced for this script,
- repeated: means the quantity of records that are read more than once,
- saved: tries to represent which will be the quantity of reads saved if we can cache all the repeated reads,
- count: represents the total of different records read from the DB (like COUNT DISTINCT)
The interpretation of this data will allow us, before we start coding a simple cache, to know if this action will decrease the execution time or not.
If there are repetitions on records, they can be cached and this way save time. But if the records have little or no repetitions, it will be a waste of time implementing the cache proposed here. Maybe you have your slow code on calculations or in other places.
Obviously the $analysis["saved"] value has to be greater than 0, the bigger the better. The ratio between saved and total will give us an idea of how many read operations we can save and in this way decrease the execution time.

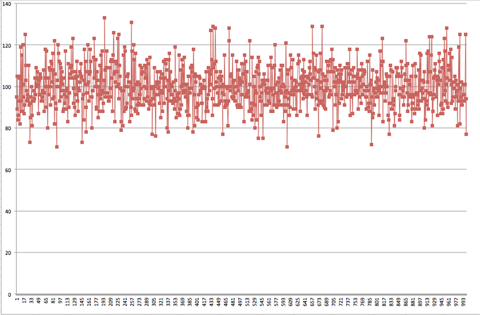
As you can see there are a lot of repeated accesses to the same records, the average is 100 per each ID. Later we will verify if this technique will improve or not our script.
Conclusion
In this part of the article we presented the theory of common approaches to detect slow code and use caching to test if it is possible to obtain significant performance gains.
In the next part of the article we will show these techniques applied to a real example that accesses a database using the PHP Preemptive Cache class to improve our script in some conditions.
If you liked this article or have a question about the techniques presented here to detect slow code, post a comment to this article.
You need to be a registered user or login to post a comment
Login Immediately with your account on:
Comments:
3. RESTful API Processes - Anthony Amolochitis (2015-09-08 14:47)
RESTful API Processes and curl... - 1 reply
Read the whole comment and replies
2. New profiling techniques - Jose (2015-09-08 08:49)
New tools for profiling PHP... - 1 reply
Read the whole comment and replies
1. Slow code - ger ler (2015-09-08 07:21)
Roughly approach to detect slow code fragments... - 2 replies
Read the whole comment and replies


